Background to Lake Sturgeon Egg Stage
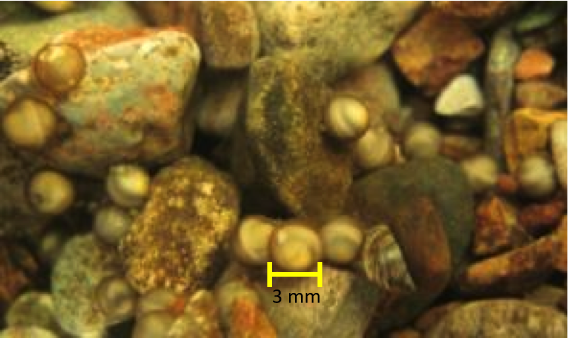
During the egg period, developing lake sturgeon are vulnerable to a host of potential predators that inhabit Great Lakes tributaries where eggs are deposited. Recent studies have shown that non-native predators such as rusty crayfish (O. rusticus), round goby (N. melanostomus) prey on lake sturgeon eggs. Also, there are microbes and fungi that attack developing embryos and feed off of dead or decaying lake sturgeon eggs.
Lake sturgeon are “Lithophilic spawners” which means during spawning, eggs are broadcast onto rocks and into crevices on the river bottom. Once in contact with water, a sialic acid mediated chemical reaction hydrolyzes compounds on the egg surface creating an adhesive property, which allows eggs to become ‘sticky’ and adhere to rocks during incubation. Spawning adults neither build a nest for egg cover, nor care for the developing offspring. Hatching may take 5-12 days dependent upon water temperature. Typically, eggs that incubate in colder temperatures take several days longer to hatch than those incubated in warmer temperatures.
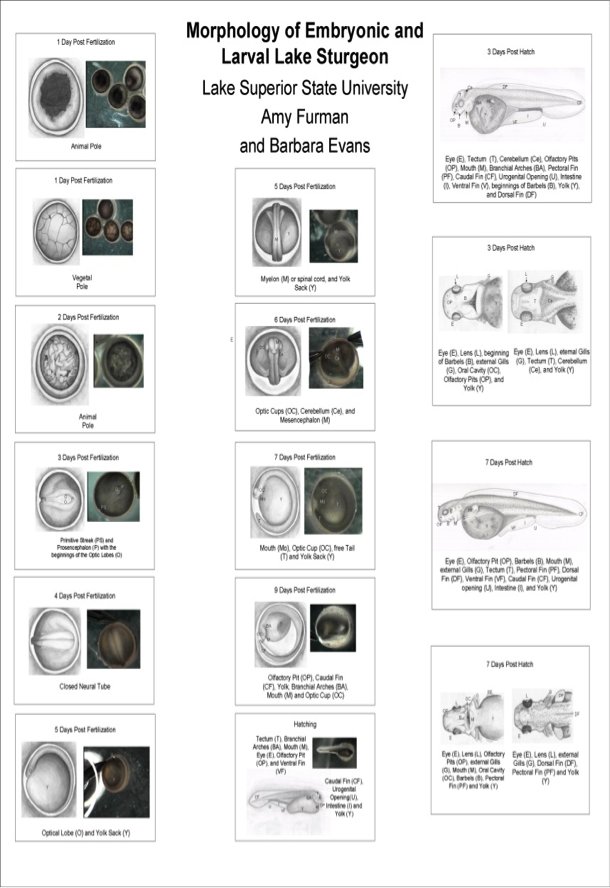
Lake sturgeon eggs and larvae can be staged using well established criteria.
Lake sturgeon females are highly fecund. A female will deposit 100,000s of eggs in one spawning event. High fecundity is important because adults provide no parental care (no nest construction or guarding of eggs or offspring), and thus mortality during early life stages, including during egg incubation is extremely high.
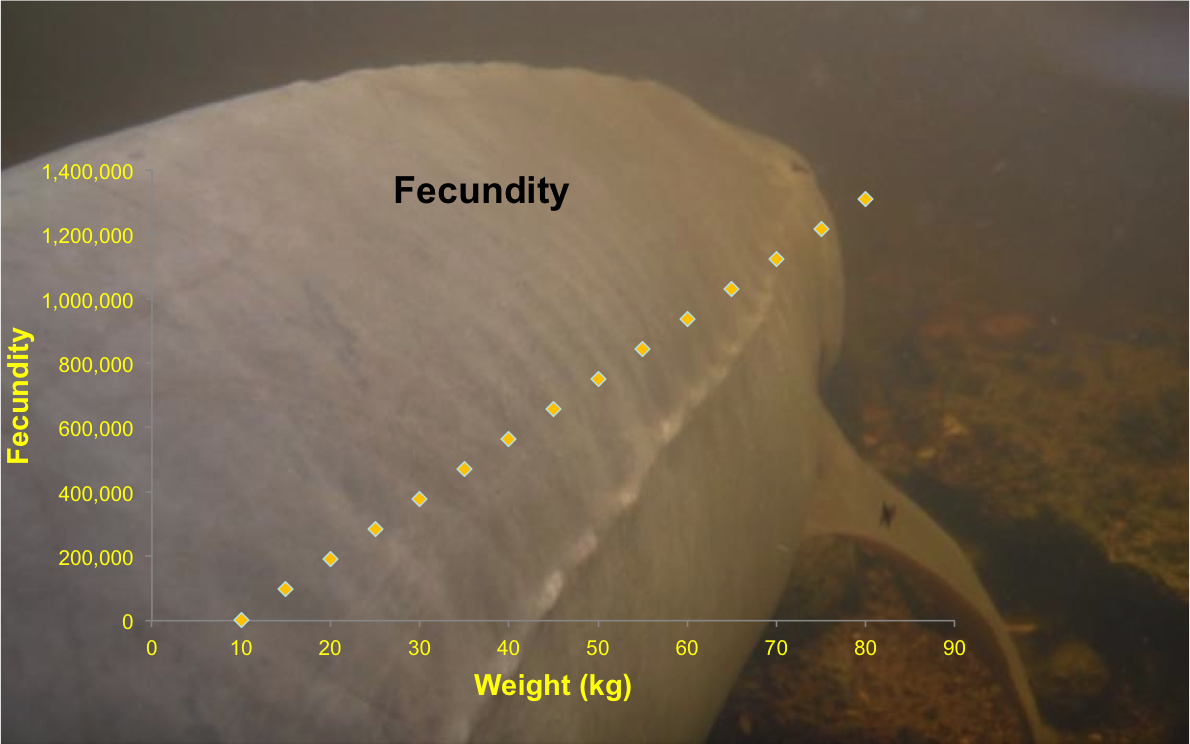
Lake sturgeon fecundity vs. weight, Winnebago System, Wisconsin, 2005–2008. (from Bruch 2008).
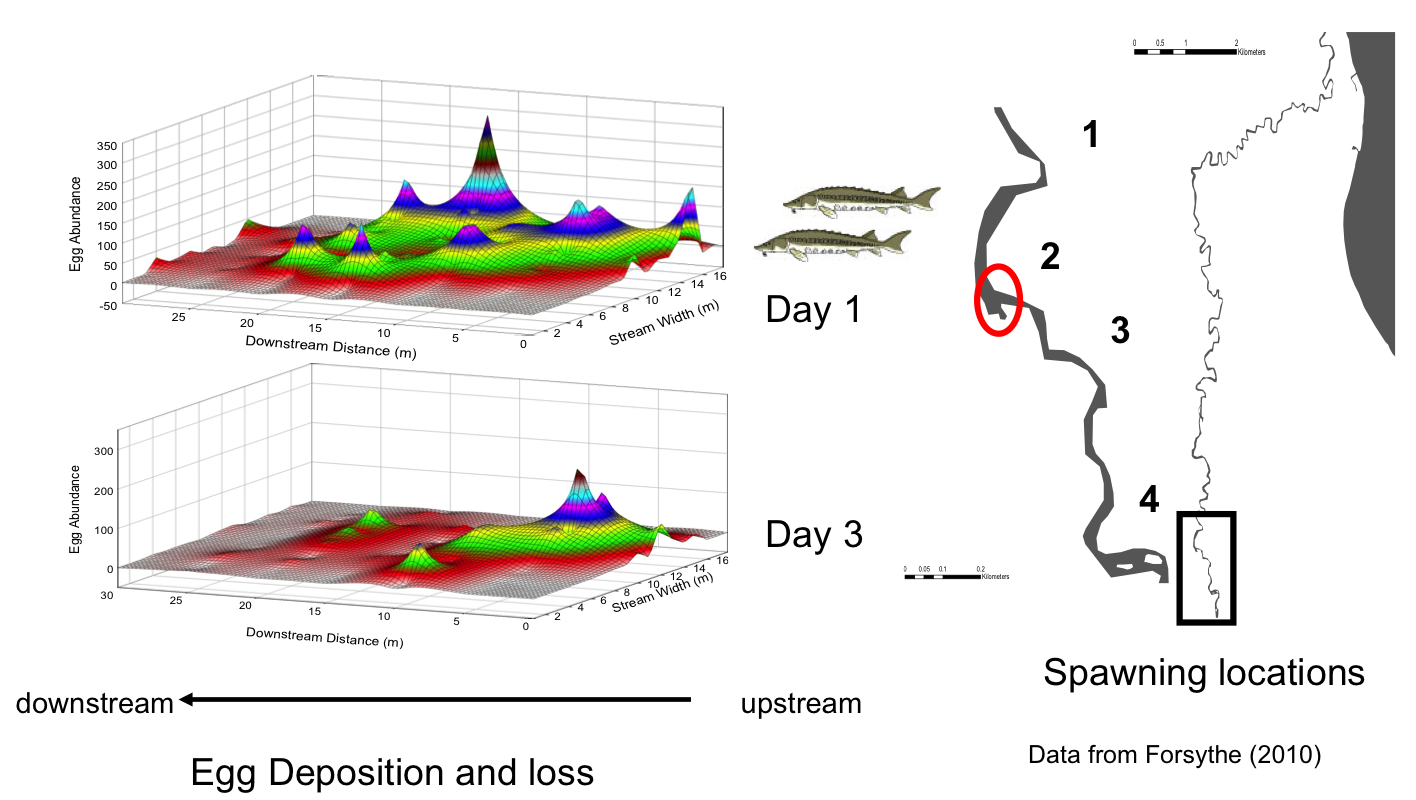
Eggs and sperm are released into the water column. Fertilized eggs develop an adhesive surface and stick to the stream substrate. The distribution of eggs is determined by the direction and rate of water flow, water depth, and the characteristics of the stream substrate. The figures below show the distributions of eggs deposited during one spawning event in the Black River. Estimates were based on transects made across the river at 5 meter intervals. The egg deposition profiles are not uniform across or downstream. Further, note the changes in profiles from day 1 to day 3 following spawning. We typically see a dramatic loss of eggs in a 2 day period. Rates of loss at this and subsequent egg and larval periods determine recruitment for the population.
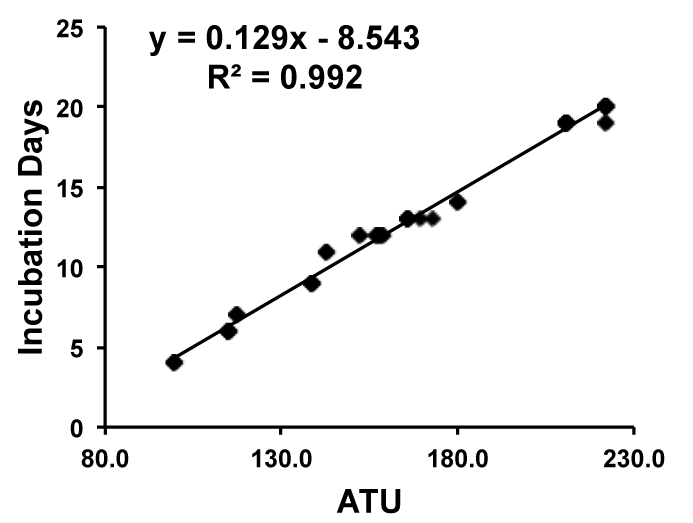
Egg development time is highly dependent on stream temperature.
This figure shows the relationship between incubation time as a function of the number of accumulated thermal units (ATU) which is estimated based on the the number of days during incubation and the stream temperature (°C) each day.
